Core Concepts
Understanding QtNodes’ architecture helps you make the right design decisions for your application.
Model-View Architecture
QtNodes follows Qt’s Model-View pattern. Your data (the Model) is separate from its visualization (the View).
Benefits of this separation:
Run graph logic without any GUI (headless mode)
Multiple views of the same data
Clear ownership: you own your data, the library owns the visuals
Easy testing of graph logic
Nodes and Connections
Graphs consist of nodes and connections.
Node identification:
Each node has a unique
NodeId(unsigned integer)You generate IDs in your model via
newNodeId()The library never creates or manages IDs for you
Connections:
A
ConnectionIdlinks an output port to an input portContains:
outNodeId,outPortIndex,inNodeId,inPortIndexConnections are directional: data flows from Out to In
// A connection from Node 1, Port 0 -> Node 2, Port 0
ConnectionId conn{
    .outNodeId = 1,
    .outPortIndex = 0,
    .inNodeId = 2,
    .inPortIndex = 0
};
The Two Programming Models
QtNodes supports two distinct approaches:
Simple Graph Model |
Data Flow Model |
|---|---|
You subclass |
You use |
You store all graph data yourself |
Library manages node instances for you |
No automatic data propagation |
Data flows automatically through connections |
Full control, more code |
Less code, follows conventions |
|
|
Choose Simple Graph Model when:
You have existing graph data structures to wrap
You need custom graph semantics
You don’t need data to flow between nodes
Choose Data Flow Model when:
Building visual programming tools
Nodes process inputs and produce outputs
You want automatic data propagation
NodeRole and PortRole
The model provides data about nodes and ports through roles (similar to
Qt’s ItemDataRole).
NodeRole – Information about a node:
// Get node position
QPointF pos = model.nodeData(nodeId, NodeRole::Position).toPointF();

// Set node caption
model.setNodeData(nodeId, NodeRole::Caption, "My Node");
Key roles: Type, Position, Caption, InPortCount, OutPortCount, Widget
PortRole – Information about a port:
// Get port data type
auto type = model.portData(nodeId, PortType::In, 0, PortRole::DataType);
Key roles: Data, DataType, Caption, ConnectionPolicyRole
See Graph Models for the complete role reference.
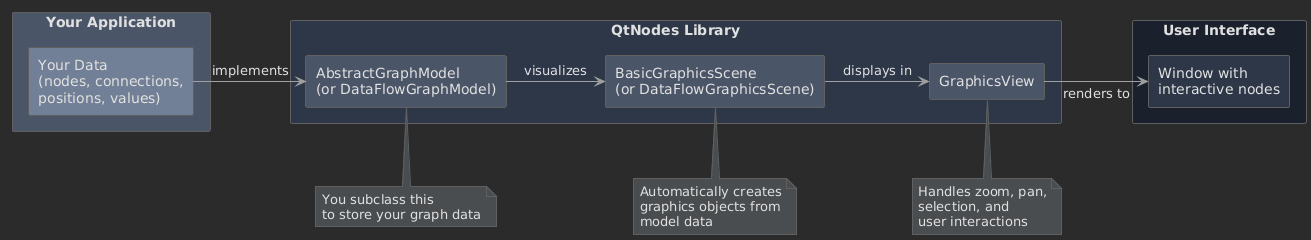
Graphics Object Hierarchy
When visualized, each model element becomes a graphics object:
GraphicsView (QGraphicsView)
  └── BasicGraphicsScene (QGraphicsScene)
        ├── NodeGraphicsObject (for each node)
        │     └── Embedded QWidget (optional)
        └── ConnectionGraphicsObject (for each connection)
Painters control how objects are drawn:
AbstractNodePainter→DefaultNodePainterAbstractConnectionPainter→DefaultConnectionPainter
You can replace these with custom painters for different visual styles.
Data Flow Deep Dive
In the data flow model, delegates handle node-specific logic:
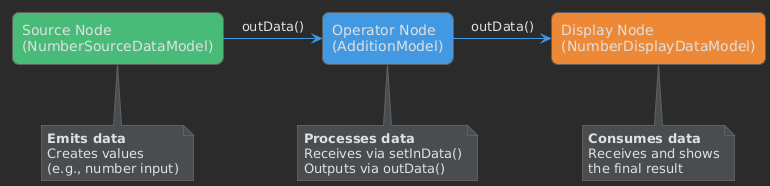
The flow:
Source node calls
emit dataUpdated(portIndex)DataFlowGraphModelcatches this signalIt calls
outData(port)on the source delegateIt calls
setInData(data, port)on all connected delegatesConnected nodes process and may emit their own
dataUpdated
Next Steps
Graph Models – Implement your own graph model
Data Flow Model – Use the data flow pattern
Examples – Study working examples